
Post
Seattle Housing Supply and Demand
When more people are seeking to sell a product that to buy it, the prices must come down. The inverse is true, high demand but low supply, means sellers can increase their prices.
In the last few years the Seattle real estate market has been incredibly competitive. There are more people looking to buy than there are homes on sale. This is a good metric for short term trends, but if three times more people decide to sell tomorrow, everything changes. So lets do more than that, and try to predict long term trends.
Instead simply looking at the number of homes for sale and number of buyers in the market, lets review larger scale population metrics. First, the demand side of things:
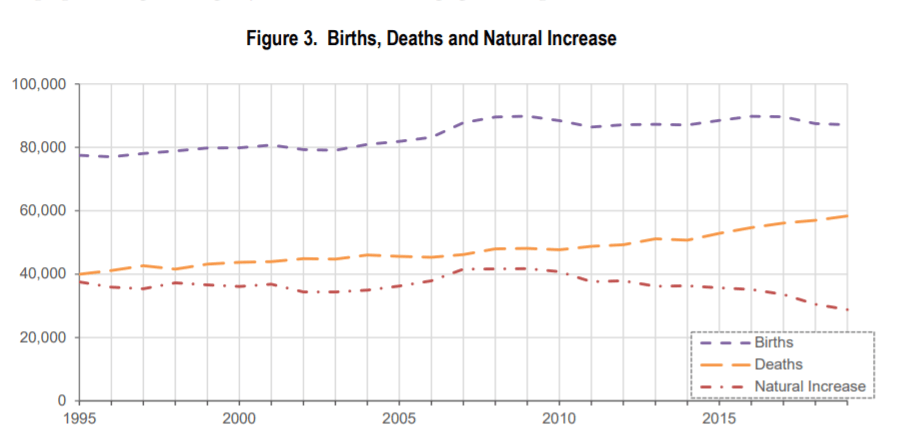
1. Seattle's natural population growth has dropped 25%
As the Seattle baby boomer population ages, we are seeing larger rates of deaths, while the number of births begins to plateau and even decrease. Our natural population growth is slowing down. Projecting out at this rate, in 60 years, more people will die than are born.
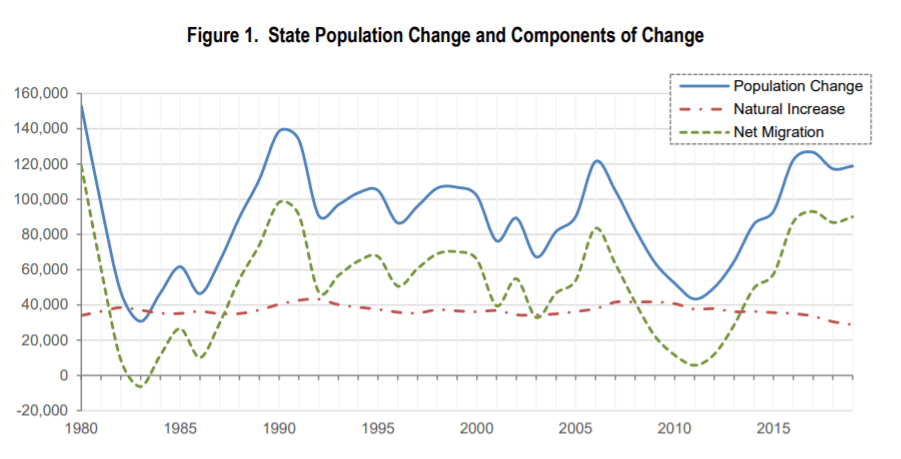
2. Total population growth is the 2nd highest its been in 40 years.
And yet, the overall population is growing due to migration from within and without the United States. Interestingly the highest population growth was the early 1990’s, when my family immigrated here because of the Immigration Act of 1990. It stands to reason future immigration laws will continue to affect this.
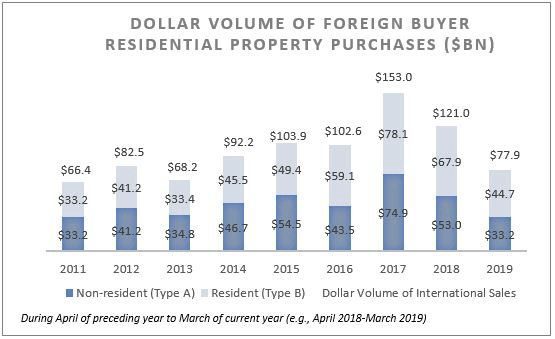
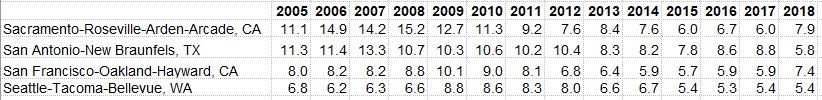
3. The China Trade war has reduced the number of foreign buyer
There has been a large reduction in the amount of foreign money pumped in to US real estate. This may have, in part, affected the small reduction of demand seen in the Seattle market during the fall of 2018.
Now, lets review our supply issues:
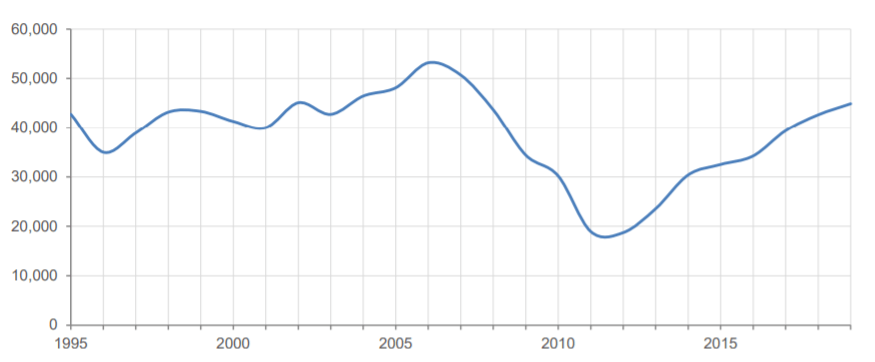
5. The 2006 Bubble has made builders too cautious, and the supply of homes has not kept up with demand
Below is the number of new homes being built nationally. We are well below average.
 Source (data in 000s)
Below is new home starts in Washington. We are pretty close to our average, after 10 year period of being below our historic average.
6. Housing vacancy rates are at an all time low
Vacancy rates refer to the homes that are don’t have full time residents (the include empty houses, or those used as seasonal vacation homes). Our current vacancy rates are the lowest in history. Generally this means there are not enough homes for the people in the area.
 Source: Data from HUD
Though its possible some of the change is people are using their second homes as temporary rentals via Airbnb. This led me to my next question: many housing units are there per person?
7. Housing units per person are very low
Since I could not find the data publicly reported anywhere, I created my own analysis from WA state census data. This compares the population of the Puget Sound, to the total existing housing units (including those on sale as well as owner/renter occupied).
This first chart includes all apartments and houses. This shows we were overbuilt in the run up during the last bubble.
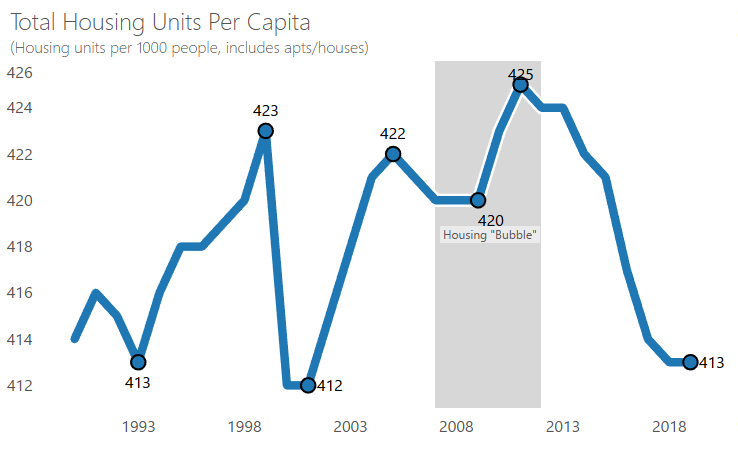 Source: Data from the US Census Bureau, for Washington state
This second chart includes all only single family houses. This shows a serious shortage of homes. Far below the historic average for the last 20 years. And again, this is not just “homes for sale” this is “all homes that exist.”
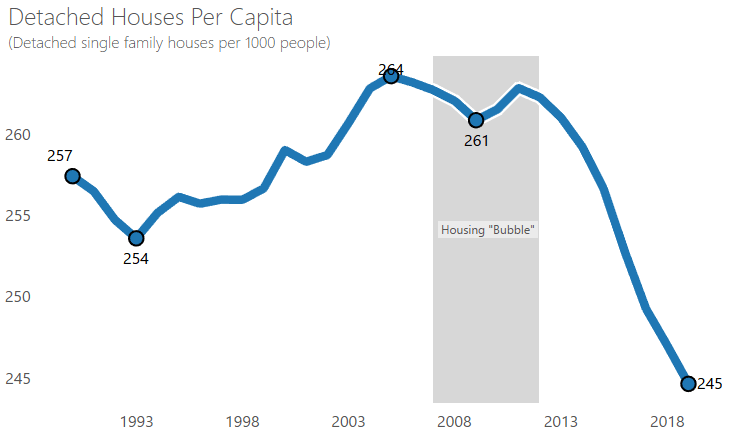 Source: Data from the US Census Bureau, for Washington state
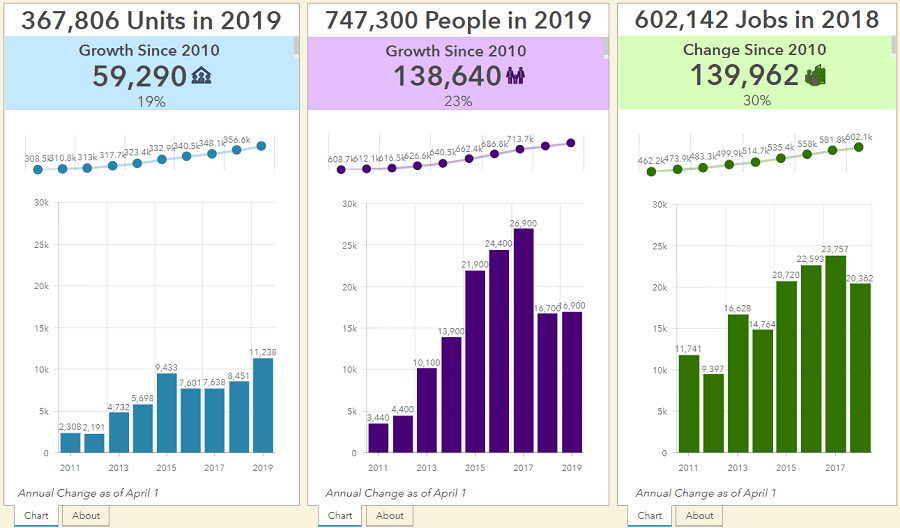
8. Seattle has low supply, and high demand.
And I’m not the only one saying this. The city of Seattle puts out a dashboard that tracks our growth. In the last 9 years, we have seen a: • 30% growth in jobs • 23% growth in population • 19% growth in housing units
Comments (1)