
Post
Seattle Housing - Are Prices Too High?
Everyone knows that “houses always go up” but then again, also that “houses are in bubble territory.” Everyone claims “buying is always better than renting” but also that “home prices are at the peak and a crash is imminent.”
Everyone knows that you should “buy low” and “sell high” but when rubber meets the road, most experts say timing the market is virtually impossible.
Renters who are sitting out and waiting for a “crash” tend to have very negative views. Owners who love seeing their equity go up, have the exact opposite narrative. Its hard to get unbiased views from either side.
A few years ago, memories of the Great Recession still lingering in my mind, I was openly a real estate pessimist. I could be found lamenting pushy real estate agents and talking about the Hoyt real estate cycle.
(Fortunately I found an agent that was ostensibly the best agent I’ve ever worked with. I still do think housing markets are cyclical - everything is - but each cycle is not a “crash,” and every local region unique - more on that in future posts.).
So why did I change my mind? Perhaps its motivated reasoning because I really wanted to provide my little dude a back yard? Possible. But I’d like to think it’s the hundreds of hours of data analysis that I performed during the last year. In the end I put my money behind my analysis and bought a house.
After pouring over hundreds of spreadsheets, python scripts, and tableau dashboards here are some of the highlights in a concise series of blog posts. Enjoy.
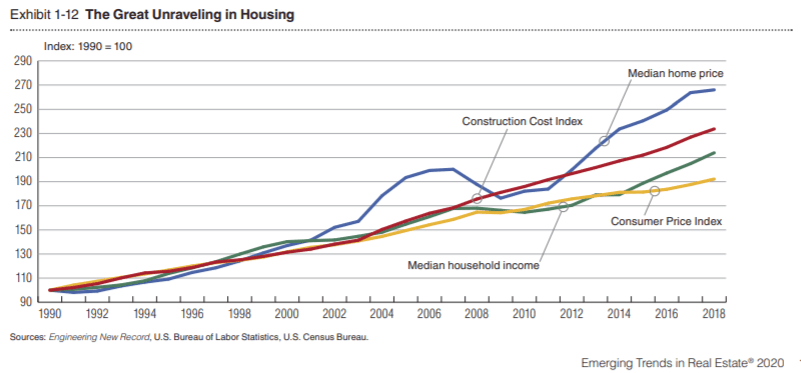
1. US (and Seattle) home prices have outpaced income, inflation, & construction costs
During the housing boom ending in 2006, home prices grew faster than all other economic measures. This includes the “Consumer Price Index,” which is a measure of inflation (“how much is a dollar worth?” Or, if you like, “how many Snicker bars can you buy with $10?”
Median home prices have appreciated faster than income and the cost of goods and services.
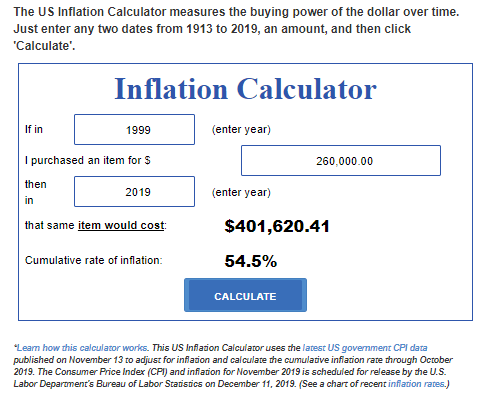
2. Inflation adjusted, home prices aren't as high as they seem
But here is where things get tricky, because over time the dollars loses its purchasing power. It takes more money to buy the same thing, whether that’s food, clothing, or an employees time. If the dollar is worth less, then it takes more of them to buy anything and everything. That rosy $260,000 house you remember? In today’s dollars - which are worth less - that’s equivalent to $401,000. Here is another way of thinking about it: when houses cost $260,000, you could have also bought 260,000 snickers bars for your $260,000. Today to buy the same number of snickers bars, you need to spend $401,000.
We can use inflation data to adjust home prices in the past to compare them to today’s dollars. The blue line shows the true list price of houses in the past.
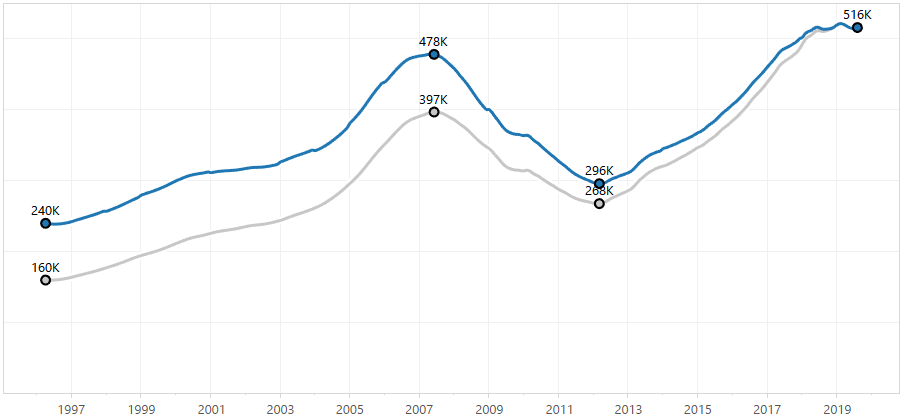 Source: Housing data from Zillow, inflation data from the BLS
3. Mortgage rate adjusted, house prices are lower
But for most people house cost is never just a matter of how much the home sells for, but rather, how much money you will spend over 30 years paying off the mortgage. Mortgage rates fluctuate dramatically, and this affects your house price more than list price.
For instance, in the last year mortgage rates dropped a percent, so the same house costs over $120,000 less, even while the list price went up by a thousand.
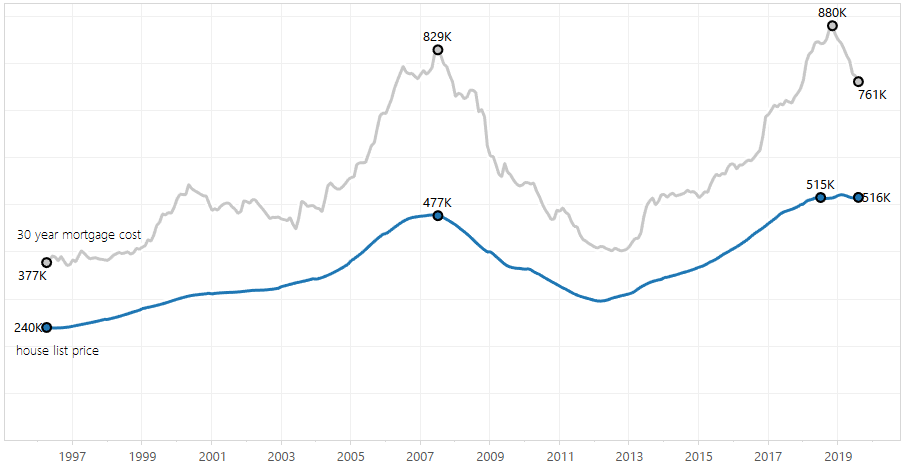 Source: Housing data from Zillow, mortgage data from Fannie Mae
These two factors, inflation and mortgage rates are not independent of each other, but they compound. If you had to pay an $800,000 mortgage in 2007, that is almost a million dollars in today’s dollars ($997,000 on the chart)
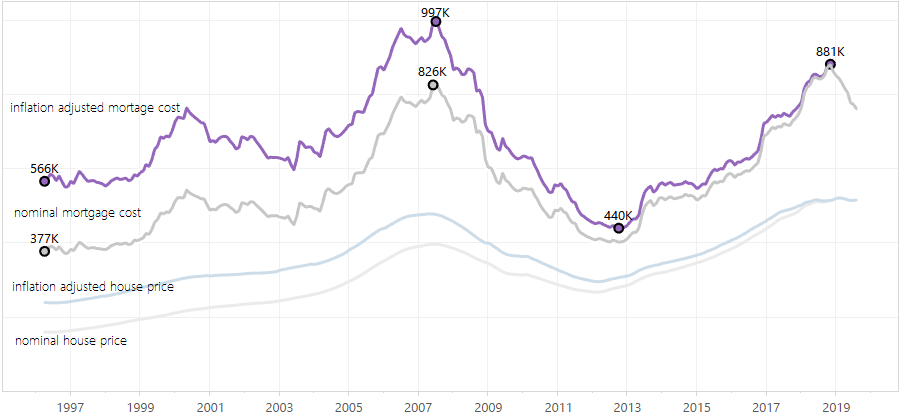 Source: Housing data from Zillow, mortgage data from Fannie Mae, inflation data from BLS
4. But income has also increase above inflation
In addition to inflation, the median household income in King and Snohomish counties has risen a significant amount (mostly from the creation of high paying jobs by large corporations like Amazon). This increase is above the rate of inflation, so people have more money to spend on housing.
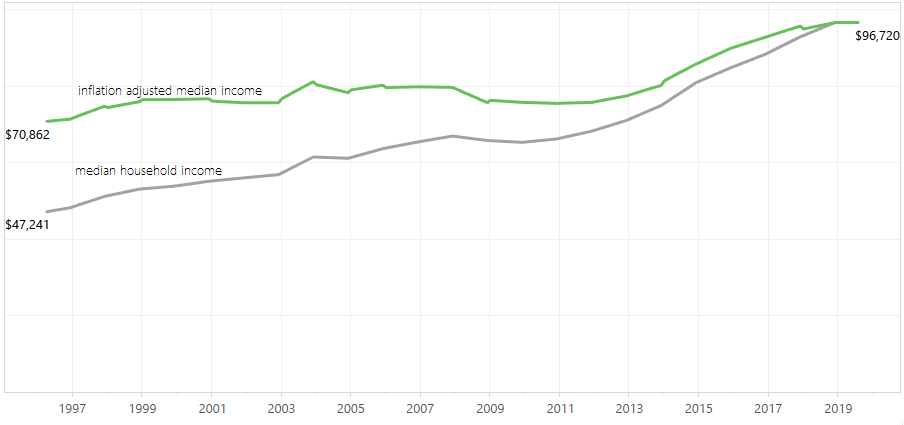 Source: Data from King County Office of Economic and Financial Analyses
5. Today's more "expensive house" will cost you less
Here are your monthly payments accounting for interest rates and inflation. The key thing to note is, in today’s dollars, the median monthly mortgage cost $2,768 at the peak of the 2007 “bubble.” Compare that to $2,115 in November 2019.
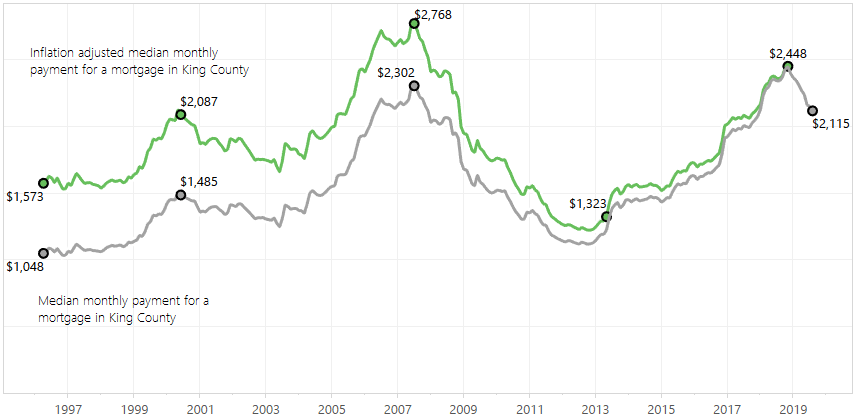 Source: Housing data from Zillow, mortgage data from Fannie Mae
6. It's cheaper to buy today than in 1997
Now, lets factor in the increased household income to calculate the percentage of your monthly income that is spent on mortgage payments.
- The end of the chart, 2019, shows us at 26%
- In the beginning, 1997, we were at 27%
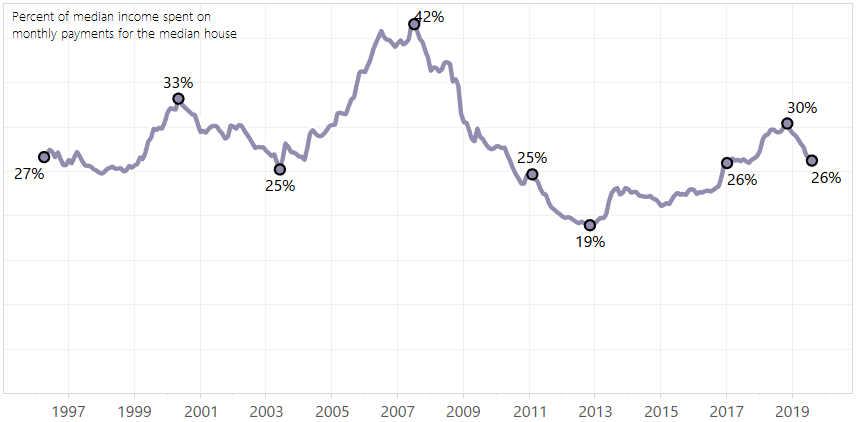
Was 1997 the peak of a horrid housing bubble that devastated everyone?
Today's mortgage rates and incomes have offset house prices to the point that they are more affordable than in 1997. Yes, 2012 was a better time to buy, so was 2013 to 2016, but these were historical exceptions to the norm. Given the low interest rates and high median income, it’s a completely average time to buy.
Comments (1)